Insurers need to keep the foot on the gas on overland flood


Insurance Business Canada reports "Insurers need to keep the foot on the gas on overland flood"

http://www.insurancebusiness.ca/expert-advice/insurers-need-to-keep-the-foot-on-the-gas-on-overland-flood-198497.aspx

Below is our comment on the article, slightly edited and with some added graphics and links.

******

Overland flood TorontoNot only is sewer back-up and urban overland flood difficult to explain to consumers as noted in the article, it is also difficult to separate in terms of the reality that urban overland risks drive sewer back-up risks at a neighbourhood level.  This analysis shows the overlap of these perils:

http://www.cityfloodmap.com/2015/08/toronto-overland-flow-factors-affect.html

Analysis is of historical flooding in Toronto in 2000, 2005 and 2013 and shows the correlation of overland risk factors (proximity to overland flow path and catchment slope) and observed basement flood reports during extreme events.  From a physics, hydrology, hydraulics perspective there should be no surprise that the perils are related because the runoff accumulation that drives wastewater system extraneous wet weather inflows (and surcharges and backs up sewers into basements) is the same runoff accumulation that defines overland flow into a window well or reverse slope driveway or walkout.  Raindrops do not know how they fit into insurance policy endorsements.

Overland flow system 1922 - former Walmsley Brook in Leaside, Toronto
Overland flow system today - reduced flow capacity / encroachment.
Essentially, insurers have covered overland event damages in the past, unknowingly, because overland risks in one part of a neighbourhood have caused sewer back-up damages in others.  But because damages are assessed at a property scale and not a neighbourhood scale, it would be impractical to deny coverage.  RSA has recently acknowledged this 'concurrent causation' of flooding.

The Toronto back-up and overland risk correlation suggests bundling of coverage should be mandatory in some areas with high overland risk.  Why?  Because insurers will be covering back-up damages anyway by insuring the neighbourhood's overland risk.

Municipalities must keep a foot on the gas on infrastructure improvements that increase the underground system capacities (the sewer systems that handle the 'small' storms).  But they must also look in the rear view mirror and assess the causes of flooding and revisit their overland drainage system management - that is map it, enforce drainage easements, prevent infill that obstructs flow paths and avoid the repeat of enclosures that have caused issues in the past.  This approach and the example above (Leaside, Toronto, former Walmsley Brook) are shown in our presentation Urban Flood Risk from Flood Plains to Floor Drains.

Causes of basement flooding. Toronto Area 32 cluster area 1.
No aging infrastructure is noted in the causes of flooding.
Municipalities should also assess impacts of pollution control activities on basement flood risks and the province should mandate that pollution control activities not aggravate flood risks.  Tanks to keep beaches clean in my neighbourhood caused basements to flood in extreme weather.  The insurance industry could work with the province on this front and participate in studies as a stakeholder when basement flood risks can are an issue.

Statements in the Insurance Business Canada article about aging infrastructure contributing to flooding are becoming tired because an old sewer doesn't lose much capacity, and even a displaced joint doesn't disrupt flow such either.  Toronto has completed 30+ detailed basement flood studies and none have pointed to aging infrastructure as a key cause of flooding.

Yes, homeowners with clogged laterals have a problem but this is not an issue for most mainline municipal sewers. The discussion must be refocused on the key factors affecting risk - if an aging concrete pipe becomes slightly rougher over time due to abrasion, this in no way compares to having the overland flow path filled in and blocked and lost forever, from a system capacity point of view.  Municipalities should prioritize efforts and embrace low cost programs that can reduce flood risks through regulations and policy (preserve overland flow paths) to complement more expensive, long-term capital upgrades to sewer systems.  Ironically, many sewers will good remaining service life (even 50 years to go) are being replaced to increase flood capacity now - not because of aging but because pre-1980's design standards did not preserve the overland flow path and now the barely-aged sewer is being upsized to compensate.

Likewise, statements on changing climate and 'excalating extreme weather' are also becoming tired and diverting attention from real causes and solutions.  Here are some facts on inaccurate statements on escalating weather: http://www.cityfloodmap.com/2015/07/storm-intensity-not-increasing-old.html

Climate Change Toronto
Statements about increasing storm intensity like those in the article and in the media go unchecked and should not be used as the rationale for increasing premiums.

While that is convenient, it moves us from an evidence-based approach to defining and solving problems (see recent post on the how Nobel Memorial Prize in Economics winner Daniel Kahneman would explain biased thinking about weather statistics and events).

Environment Canada's data does not show increasing trends in rain intensity - its a fact - here is an update with the latest data set and it echos statements by Environment Canada in 2011: http://www.cityfloodmap.com/2015/10/bogus-statements-on-storms-in-cbcnewsca.html

***

Spinach is not high in iron (sorry Popeye, it was a misplaced decimal point by a German chemist) - but a repeated story becomes fact in the mind of the public.  So lets stay focused on facts and not anecdotes and continue to 'kick the tires' on assumptions when it comes to flooding... just like we would with a new Volkswagon.

Thinking Fast and Slow About Extreme Weather and Climate Change

Thinking, Fast and Slow is a best-selling[1] 2011 book by Nobel Memorial Prize in Economics winner Daniel Kahneman which summarizes research that he conducted over decades, often in collaboration with Amos Tversky.[2][3] It covers all three phases of his career: his early days working on cognitive biases, his work on prospect theory, and his later work on happiness.
The book's central thesis is a dichotomy between two modes of thought: "System 1" is fast, instinctive and emotional; "System 2" is slower, more deliberative, and more logical.

The book delineates cognitive biases associated with each type of thinking, starting with Kahneman's own research on loss aversion. From framing choices to people's tendency to substitute an easy-to-answer question for one that is harder, the book highlights several decades of academic research to suggest that people place too much confidence in human judgment.
Source - Wikipedia

*******
Why talk about this book on this blog? Because it can explain, through the lens of Kahneman's research, biases in our thinking and understanding of extreme weather, flooding and climate change.

Kahneman's research helps explain to how the media, the public, and groups without scientific resources substitute an easy to answer question on meteorology for the harder ones on urban hydrology, infrastructure hydraulics, multi-objective decision making, extreme value statistics and risk assessment.  Here are some examples of the biases in thinking:

Heuristic biases

Anchoring or focalism is a cognitive bias that describes the common human tendency to rely too heavily on the first piece of information offered (the "anchor") when making decisions. In the context of extreme weather and climate change, most people have been exposed to well-documented temperature trend data for example from Al Gore in An Inconvenient Truth, and may use this "anchor" when making decisions about extreme rainfall trends (i.e., they assume historical rainfall trends are the same as temperature trends):

Exposure to temperature trend data anchors decision making on rainfall trends.  Exposure to trend data on annual rainfall (e.g., frequency of days with precipitation during a year) anchors decision making on frequency of short duration rainfall events that cause flooding - this is despite the fact that days with precipitation represents even minuscule 'trace' rainfall events (< 0.5 mm depth) while flood events typically require 100 times that threshold of rain (e.g., 50 mm depth).

Having weather personalities report that after extreme storms we had more than a month's rain in x hours, for example, anchors the public's perception about the frequency, or rarity, of the event when in fact a statistical evaluation of rainfall extremes would show that exceeding average summer monthly rainfall totals is not rare.

For example, after the July 8, 2013 storm in Toronto, where 126.0 mm of rainfall was recorded at Pearson Airport, the National Post reported "Before Monday, the highest rainfall ever experienced in Toronto for July 8 was 29.2 mm set in 2008 — a record that was more than tripled".  Tripling records sounds extreme when referred to a particular calendar day and anchors perception of rarity - but calendar days statistics are irrelevant given that summer convective storms are uncommon and 2/3 of July days are dry - furthermore daily totals of a similar magnitude were recorded twice before in 1980 and 1954 (119.9 mm and 137.4 mm respectively), and the previous July 8 record was exceeded by 200% in 7 other years between 1950 and 2013.  Headlines or course try to emphasize the rarity of events, not the commonplace.


In presenting Insurance Bureau of Canada and Institute for Catastrophic Loss Reduction's  "Telling the Weather Story" to the Empire Club in 2012 (YouTube) Dr. McBean first presents trends on temperature and discusses them for five minutes showing undeniable trends in warming, and warming rate - this anchors listeners.  He then switches to rainfall but shows no data, and instead only a theoretical bell curve frequency shift (see 13:10 in the video), but then concludes storm frequency is increasing as well. The listeners' cognitive bias due to anchoring on temperature will allow them to readily accept rainfall increases as facts as well, as opposed to recognizing rainfall increases as theoretical speculation as fully explored in this blog post and slide deck and in fact confirmed by Environment Canada and the CBC in response to inaccurate reporting.

The availability heuristic is a mental shortcut that occurs when people make judgments about the probability of events by how easy it is to think of examples.  In the context of extreme rainfall, 24-hour weather broadcasting, and 24-hour new channels give the public many example of flooding events that skew the perceived probability of occurrence. Hurricane Katrina and Hurricane Sandy are examples of extreme flooding that the public can recall in the context of flooding, but that have little relevance to urban flooding caused by convective thunderstorms. Likewise for Tsunamis.  Other types of flood events caused in large part by operational issues and inherent vulnerabilities are recalled and mistakenly associated with extreme rainfall as the sole cause (Union Station flooding June 1, 2012 was due to construction pump bypass capacity specifications, GO Train flooding July 8, 2013 due to rail line vulnerability (being below known moderate frequency flood levels)). 


GO Train flood 2013
Go Train Flood - Don River Floodplain - July 8, 2013
The availability heuristic leads to systematic biases, demonstrated in the judged frequency of repeated events.  It is irrelevant
GO Train flood 1981
Stranded GO Train in 1981 in same location as the
stranded GO Train in 2013 in the Don River valley.
that GO Train rail area flooding occurred on December 25, 1979, January 11, 1980, March 21, 1980, April 14, 1980, February 11, 1981 and May 11, 1981.  Under the availability heuristic people tend to heavily weigh their judgments toward more recent information, making new opinions biased toward that latest news. Nobody knows that the May 29, 2013 flood was worse (higher rainfall in East York, higher flow and flood levels at Todmorden gauge near the site) - because the train schedule missed the flood timing! Nobody remembers Ivan Lorant's flood inquiry report for Premier Bill Davis in the early 1980's.  Nobody asked the Toronto and Region Conservation Authority if this was a flood prone area and if this extent of flooding was unusual at the GO Train flood site. Nobody asked the Port Authority if the lack of Keating Channel dredging in the past few years contributed to flooding, just like it did in the early 1980's before the inquiry. 
Attribute substitution is a psychological process thought to underlie a number of cognitive biases and perceptual illusions. It occurs when an individual has to make a judgment that is computationally complex target attribute, and instead substitutes a more easily calculated heuristic attribute. This substitution is thought of as taking place in the automatic intuitive judgment system (System 1), rather than the more self-aware reflective system (System 2). Hence, when someone tries to answer a difficult question, they may actually answer a related but different question, without realizing that a substitution has taken place. This explains why individuals can be unaware of their own biases, and why biases persist even when the subject is made aware of them.
Urban flooding
System 2 thinking about flooding must consider rain, runoff, flow and
flooding processes - a slow, effortful. complex and reliable approach.

As rain first causes runoff, which then creates flow, which then causes flooding, it is easy to mistakenly correlate increased flooding to increased rainfall.  The alternative is analyzing the complex problems of urban hydrology changes that influence runoff, the stormwater management mitigation measures that can lessen some impacts of some development at some scales, hydraulic interaction in the flow systems including riverine systems (Lisgar District Basement Water Infiltration Assessment is a wonderful example in Mississauga, or Basement Flooding Areas 4 and 5 in Toronto (see page 4 in the Executive Summary on Black Creek interaction)) with the overland, underground separated, combined and partially separated sewers, hydraulic impacts of operational constraints (bypass pumping during construction, inadequate dredging), hydraulic impacts of environmental protection measures (provincial F-5-5 compliance, federal Fisheries Act compliance, etc.), and hydraulic impacts of development intensification on overland flow routes and interactions with underground systems and private systems.  It is much easier to focus only on rainfall. And, conveniently, everyone has an opinion about the weather.

******
Many prominent organizations and individuals have established a cognitive bias based on temperature trends and have since applied Kahneman's fast and error-prone System 1 thinking approach to rainfall extremes.  The anchoring bias in media report emphasizes the rarity / frequency of events and ignores past events and other causes (operational or intrinsic vulnerability) of flooding - Environment Canada's extreme rainfall frequency and trend data is ignored. The availability bias of extreme flooding events reported through the media skews the public's perception on the true probability of events - it is very easy to find examples of flooded underpasses because these are designed to lower flood standards, but flood a lawyer's Ferrari in an underpass and it will be ingrained in the public's mind for a long time. Attribute substitution bias allows the public to simplify and explain flooding with rainfall (rain = flood) as opposed to thinking about the actual complex system (rain = baseline runoff + development runoff +- mitigation measures = flow +- capacity constraints +- operational factors = flooding).

Media support attribute substitution by ignoring even the most fundamental physical facts. For example, the GO Train flood on July 8, 2013 was cited as a 2013 Top Weather Story by CBC News as they associated the record at Pearson Airport with the flooding (record rain somewhere = flooding somewhere else).  They ignored the fact that Pearson is in the Etobicoke Creek Watershed, three watersheds away from the Don River Watershed where the GO Train flooded - this is basic hydrology: Mississauga rain = runoff in Etobicoke Creek, not in Don River). They ignored that no record rainfall occurred in the Don River Watershed as they were anchored to the Mississauga data 25 km away.GO Train Worst Flood

*******
System 2 Mode of Thought -  Data and Analysis - Slow, Methodical.
Source: Environment Canada Engineering Climate Datasets ver 2.3.
Evidence-based policies require us to check facts: 

“There will still be times when someone accuses us of having lost our way, of having chosen the wrong priorities, and I know that can be hard to hear. But in moments in great and important choice, when the stakes are high, and the consequences are long-lasting, we have to test our assumptions.” Premier Kathleen Wynne, AGM, June 6, 2015 


System 1 Mode of Thought - Infographics and Heuristics - Fast, Emotional.
Source: Environmental Commissioner of Ontario,
Connecting the Dots on Climate Data in Ontario.

Testing assumptions requires Kahneman's "System 2" thinking - slow, deliberate and logical, as opposed to fast, instinctive and emotional in order to overcome heuristic biases in our thinking. 

Please. More Data.

Fewer Infographics.

*******

"People are not accustomed to thinking hard, and are often content to trust a plausible judgment that comes to mind."


Daniel Kahneman, American Economic Review 93 (5) December 2003, p. 1450


********
Robert Muir's presentation on infrastructure adaptation to the WEAO OWWA Joint Climate Change Committee explores in significant detail the trends in Southern Ontario rainfall extremes that affect flood risk and that drive mitigation priorities:


Infrastructure Resiliency and Adaptation for Climate Change and Today’s Extremes from Robert Muir

***
Tada! "Thinking Fast and Slow" themes in the above post have been expanded and are now published in the Journal of Water Management Modelling with the title "Evidence Based Policy Gaps in Water Resources: Thinking Fast and Slow on Floods and Flow":

https://www.chijournal.org/C449


Environment Canada Denies Change in Rainfall Events Over Past Decades

While there are many reasons to address climate change, increasing rainfall and resulting flood damages is not one of them.  Environment Canada, federal the agency responsible for collecting and analyzing weather data in Canada, agrees.  In response to a complaint on rainfall frequency reporting at CBC, Environment Canada has verified that there has been no significant change in rainfall events over several decades:

Excerpt. Environment Canada verifies no significant change
 in rainfall events over several decades.
Extreme rainfall reporting often goes like this, leading many to believe rainfall is increasing and leading to inaccurate reporting:

1) A convective summer thunderstorm drops 100 to 150 mm of rainfall over an urban areas that has been intensifying over decades (i.e., more runoff), and that can have drainage infrastructure constraints due to operational or structural changes (i.e., less flow capacity).

2) Flooding happens. 

3) Weather personalities share a characterization like "wow, we had a month of rain this afternoon folks", forgetting to mention that it doesn't rain much in the summer anyway and that 100 to 150 mm of rainfall is not an unusual event from an extreme value statistical point of view.

4) Many photos and videos are shared showing flooding in road underpasses, sometimes with expensive cars and stories about the owner - but the intrinsic built-in design vulnerability of underpasses in drainage design is not acknowledged.  (See 'subway' or 'depressed roadway' in MTO design criteria documents.  Or 'underpass' in Toronto design criteria.)

5) The insurance industry settles many flood claims at a great cost because it cannot distinguish if the event met policy restrictions, technically cannot characterize the neighbourhood scale factors that could exclude coverage, and perhaps legally cannot take the chance that unclear policy clauses on sewage back-up will not stand up in court if claims are denied.

6) There is no follow up discussion on the importance of runoff and how development intensification increases it, or that runoff mitigation measures are often sized to handle "smaller than extreme" events. (Public appreciation for hydrologic principles is very low, with focus group surveys suggesting many believe a 'watershed' is an building on the back lot for storing water.)

7) There is no follow up discussion on flow capacity and how it is constrained due to operational or structural changes to drainage and wastewater infrastructure. (This is a liability issue for the operator if the impacts of the changes were not carefully addressed.)  Also no follow up on the intrinsic vulnerability of underpasses which are sized by design, based on economic and technical constraints to handle only moderate storms and flows. (My experience is that capacity to handle a 100 year storm in an underpass, with 100 % redundancy in terms of back-up pumps, and stand-by diesel power, is rare - the depressed 400 series highway in Windsor may be the only one with this high level of service in the Ontario (i.e., Herb Gray /Windsor Essex Parkway).

8) Climate change modellers predict more extreme rainfall under some scenarios, despite having no models to simulate convective thunderstorms, and despite not using predictive models with a spatial or temporal resolution to analyze short term rainfall events (i.e., minutes and hours durations).  (The Ministry of the Environment in Ontario's expert panel indicated "Climate change science and modelling currently is not at a level of detail suitable for stormwater management where knowledge of the intensity, duration, frequency of storms and their locations and timing is required." - as per the report at this link)

9) People want answers and increased rainfall frequency or severity seems plausible, and besides, runoff discussions and flow capacity discussions are complex and not addressed.

10) Its 2015, and climate change temperature trends over years and decades are mistakenly considered to be the same as the short term extreme rainfall trends.

This is where we are today in the midst of an important discussion on climate change mitigation and carbon pricing.  Many climate change reports conflate temperature and rain.  Insurance industry conveniently points to rain as the reason insurance premiums are increasing, not saying how low investment returns by property and casualty insurers are forcing those companies to no longer subsidize underwriting activities as in past decades - that is increasing premiums.

Here are some resources and facts on the issues with today's rainfall frequency reporting:

1) Rainfall extremes happen.  Environment Canada publishes extreme value statistics as part of their Engineering Climate Datasets and exceeding "100 year storm" rainfall is not unusual.
  • All the data is here: http://climate.weather.gc.ca/prods_servs/engineering_e.html
  • It is a challenge to navigate but the intensity duration frequency files have information to show at each weather station when and how "100 year storms" were exceeded.  For example in Toronto's 61 year record at the Bloor Street gauge, we exceeded 100 year extremes in 1954, 1962, 1977, twice in 1986 (NB - neither August 19, 2005, not July 8, 2013 exceeded 100 years in downtown Toronto).
Excerpt from Table 1 Annual Maxium in file: idf_v2-3_2014_12_21_615_ON_6158355_TORONTO_CITY.txt
Version 2.3 data set for Ontario file: IDF_v2.30_2014_12_21_ON.zip

  • Rainfall intensity for duration of interest that cause flooding in urban areas is not increasing as Environment Canada has verified in response to our complaint on inaccurate reporting in this story :
Excerpt. CBC confirms Environment Canada has verified no change in rainfall over decades..
  • Here is our summary of Canada-wide rainfall trends in the Engineering Climate Dataset which shows for 565 weather gauges :
    • there is no statistically significant change in rainfall intensity for 86% of data points
    • there is a statistically significant decrease for 2 to 3% of data
    • there is a statistically significant increase for 3 to 5% of data
    • there is incomplete data for trend analysis 7% of the time
    • for shortest duration rainfall that affects urban flooding, just less than 3% of data shows increases in intensity (5 minute intensity increases at 2.7% of gauges)
     
    Climate Change Canada
    Real climate data from Environment Canada shows no change in historical rainfall intensities.
    Trend data file used: idf_v2-3_2014_12_21_trends.txt
    From Environment Canada's file: IDF_Additional_Additionnel_v2.30.zip

2) Flooding happens when rainfall extremes exceed the design capacity of our drainage systems and because those systems are becoming more and more constrained.
  • Underpasses are designed for 10-year to 25 year storms in some cases (check the Toronto criteria here in the design standards).
  • Over a many years, underpasses have a high risk of flooding, for example, sized for a 10-year storm flood frequency there is a 41.0% chance of flooding in 5 years, or sized for a 25-year storm there is a 33.5% chance over 10 years.  This is a nice summary table of risks: 
Source : Reference Guide for Applying Risk and Reliability-Based Approaches for Bridge Scour Protection,
NCHRP Report 761, 2013.

  • The Don River floodplain that floods the Don Valley Parkway in Toronto and that flooded the GO Train rail line on July 8, 2013 floods because of an intrinsically low design capacity.  Or put another way, there is inadequate "freeboard", or buffer, between the elevation of the travelled lanes and rail bed and the moderate and extreme water levels of the river.
  • The 1981 inquiry into Toronto's Don River flooding sheds light on past railway flooding, including the area of the infamous GO Train flooding on July 8, 2013.  The 81 page report is available at the Toronto Reference Library:
    http://www.torontopubliclibrary.ca/detail.jsp?Entt=RDM209381&R=209381
  • The inquiry report provides a chronology of 40 Don River flood events during both ice-jam and ice-free conditions dating back to spring 1801 when aboriginals could not spear fish for salmon due to the post-flood high turbidity levels.  Railway line damage and flooding during ice-free conditions (i.e., no ice blockage of bridges) was reported in the "Great Flood" on September 13, 1878, the spring of 1914, and during two storms in 1980 (March and April).  Limited flooding was also reported on May 11, 1981 including the area of the Bayview Extension and the Toronto Brick Yards - the stranded GO Train incident occurred was just south-west of the Brick Yards (now the Evergreen Brick Works).  The report indicates that train operation has halted, or trains were detoured during floods, including December 25, 1979, January 11, 1980, March 21, 1980, April 14, 1980, February 11, 1981 and May 11, 1981.

3) After extreme events weather personalities / presenters compare weather extremes to climate "normals", or averages, which exaggerates the severity of the storm event.
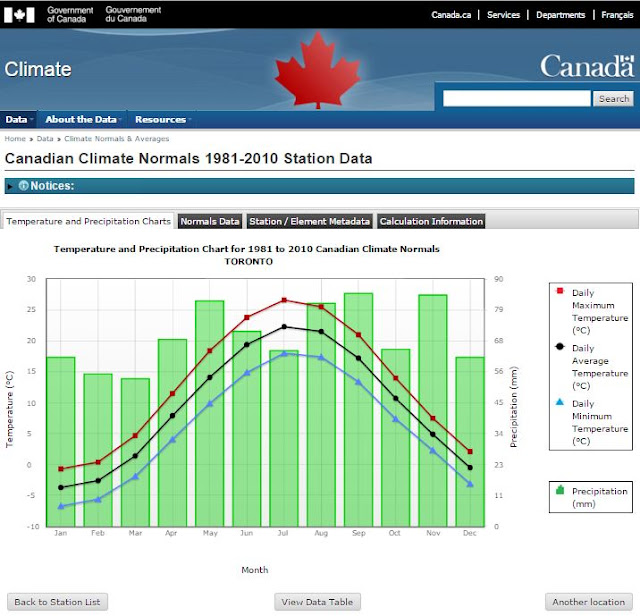
  • Environment Canada publishes normals including average monthly rainfall amounts are low in the summer.  For example, in Toronto the average rainfall for July is 63.9 mm, as shown below or at this link

  • The rainfall statistics for Toronto show that even a moderate frequency "10 year storm", with 67.6 mm of rain over a day, exceeds the monthly average by 6%.  So why would we be surprised that some more extreme storms exceed the monthly total - as noted above, there is 41% chance we will have a 10 year storm every five years?
    Table 2a Return Period Rainfall Amounts (mm) in file: idf_v2-3_2014_12_21_615_ON_6158355_TORONTO_CITY.txt
    Version 2.3 data set for Ontario file: IDF_v2.30_2014_12_21_ON.zip
Nobel Memorial Prize in Economics winner Daniel Kahneman explains why humans struggle to think statistically. We substitute heuristics for methodical thought.  So an evaluation of infrastructure vulnerabilities is not within our capabilities in many cases - please see our next post for an exploration of heuristic biases that can influence reporting on extreme rainfall, flooding and climate change.

***

Extreme rainfall trends in Canada (Environment Canada Engineering Climate Datasets) are documented in the following posts:

Static Maps: http://www.cityfloodmap.com/2015/12/severe-storm-trends-canada-rainfall.html

Interactive Map: http://www.cityfloodmap.com/2015/12/canadian-extreme-rainfall-map-climate.html

Table Summaries: http://www.cityfloodmap.com/2015/12/canadian-extreme-rainfall-summary-by.html

Chart and Table: http://www.cityfloodmap.com/2015/12/top-weather-story-in-canada-2015-less.html

Long-term Station Table: http://www.cityfloodmap.com/2015/12/long-term-climate-change-short-term.html

Environment Canada Denies Changes: http://www.cityfloodmap.com/2015/10/bogus-statements-on-storms-in-cbcnewsca.html

Contradicting Insurance Industry Claims: http://www.cityfloodmap.com/2015/12/trends-in-canadian-shortduration.html

Ontario Climate Change Policy - Minister Murray Ignores Rainfall Data, Conflates Climate and Weather

climate change ontario
No real change in Canadian rainfall extreme weather.
Environment Canada's Engineering Climate Datasets v2.3.
Below is CityFloodMap's response to the brief CBC report on the Ontario government's climate change plan. The leaked cap and trade plan would not go ahead if these facts were considered:

***********************************

Murray said severe weather events have cost the government hundreds of millions. But Environment Canada verified no significant change in rainfall events over decades: 

http://www.cityfloodmap.com/2015/07/storm-intensity-not-increasing-old.html 

CBC has corrected their earlier reporting on storm trends as a result of these facts: 

http://www.cityfloodmap.com/2015/10/bogus-statements-on-storms-in-cbcnewsca.html 

Don't "Blame it on the Rain" like MiIli Vanilli because there are other factors that quantitatively explain increasing flood damages in Ontario as in my letter to the Minister: 

http://www.cityfloodmap.com/2015/08/letter-to-ontario-minister-of.html 

Evidence-based policies require us to check facts: 

“There will still be times when someone accuses us of having lost our way, of having chosen the wrong priorities, and I know that can be hard to hear. But in moments in great and important choice, when the stakes are high, and the consequences are long-lasting, we have to test our assumptions.” Premier Kathleen Wynne, AGM, June 6, 2015 

Now is a good time. The insurance industry has been off base for several years on rainfall facts and is WAY out of step with Environment Canada data. Milli Vanilli's step aside: 

http://www.cityfloodmap.com/2015/11/milli-vanilli-blame-it-on-rain.html 

The GO Train rail line has flooded for centuries and decades as reported in the flood inquiry report to Premier Davis (Keating Channel dredging is behind schedule): 

http://www.cityfloodmap.com/2015/07/go-train-flooding-not-new-1981-inquiry.html 

Its time to start connecting to dots on climate change and have Ontario graduate from infographics and spin, and to real science and real evidence based policy: 

http://www.cityfloodmap.com/2015/07/connecting-dots-on-climate-change-100.html

Premier Kathleen Wynne and Ontario Ministers of the Environment and Climate Change, Natural Resources, Infrastructure, Municipal Affairs and Housing, its time to 'slow down the thinking' on extreme weather (a la Daniel Kahneman) and overcome heuristic biases:

http://www.cityfloodmap.com/2015/11/thinking-fast-and-slow-about-extreme.html

The Ontario Chamber of Commerce should demand that Ontario govenment look at the big picture and misstatements on climate change impacts. If it did, it would realize that it should be investing in Design Standard Adaptation and funding municipalities to address flood risks, and not be tilting to windmills (err.. turbines) as a means of Climate Change Mitigation - detailed analysis of flood causes supports a more focused and rational approach to flood issues in Ontario:

http://www.cityfloodmap.com/2016/04/design-standard-adaptation-vs-climate.html

How We Communicate on Flooding - Social Media Connections - RIP Evidence Based Policy

Evidence-based policies require strong communication to support education and data sharing to build a better understanding of issues. Here are some connections between government agencies and insurance industry players who have a role in flood management :
Can you find Environment Canada in the twitter network above to find out who is following whom? Unfortunately Environment Canada (@environmentca), the federal agency that collects and analyzes extreme rainfall data that shows storm intensities are not increasing, is not prominent in communications.  They do not effectively communicate rain data trends like this:
Real data from Engineering Climate Data Set, Version 2.3.

Who is more prominent in terms of communication on flooding? The Ontario Ministry of the Environment and Climate Change is (@environmentont), but unfortunately they only provide the following infographics on weather and climate, which is not helpful in any way to understanding flood issues:

Connecting the dots on climate change infographics. Non data.  Nonsense.

The insurance industry is prominent in terms of communication on flooding and rainfall extremes, for example @insurancebureau, @iclrcanada, @avivacanada, or @the_cooperators. Unfortunately, Insurance Bureau of Canada's publications through the Institute for Catastrophic Loss Reduction substitute theoretical speculation on climate for actual data on historical extreme weather:

Mathematical conjecture, statistical smoke and mirrors are used by IBC to explain weather phemonena.  In this case, a theoretical one standard deviation shift in a bell curve is used as the basis for explaining Environment Canada rainfall trends.


 A full review of the insurance industry's promotion of incorrect data is in our previous post.

Unfortunately, in this age of Twitter, 140 characters are not enough to explain science, facts, evidence, details, engineering principles, analysis, etc. in any meaningful way and so society is often left uninformed and misled.

Evidence-based policies that must be built on substance and not infographics and mathematical conjecture.

The Ontario Government's is off track and has somehow linked flood damages to climate change, when in fact Environment Canada data shows no increase in storm intensities.

In a CBC report the Minister of the Environment and Climate Change says "Governments, too, are also getting hit. Murray said severe weather events have cost the government hundreds of millions."

Yes damages are increasing but storm frequency is not, so why mention weather events in the roll out of the government's climate change policy at all?  Flood damages are not caused by temperatures increases due to climate change. And extreme weather is different than long term climate.  Dear Minister, will you not respond to my letter?

Oh well, this post is longer than 140 characters so I have lost many of you by now and you have been distracted by some Google ad for drones .. no, wait, that was me.

RIP evidence-based policy in Ontario.


.

Low Insurance Industry Investment Returns Push Premiums Higher

It is common (convenient?) for the insurance industry to explain increased premiums due to storm frequency. In response to our complaint on inaccurate reporting from an insurance broker's newsletter, the CBC has acknowledged "Environment Canada verified that there has been no significant change in rainfall events over several decades" in a letter to us.  People are catching on that we cannot just Blame it on the Rain.

So what are the real factors pushing damages and premiums higher? CityFloodMap.Com explores many factors that increase damages and add cost pressures in our letter the the Minister of the Environment and Climate Change.  But there are factors beyond the physically obvious watershed hydrology and infrastructure hydraulics.

Macro economic factors affecting insurance industry investments are the unspoken factor that puts upward pressure on premiums for property and casualty insurers in Canada.  Details are in Facts of the Property and Casualty Insurance Industry in Canada 2015 is published by Insurance Bureau of Canada (IBC).

Previously, insurance company investments earned double digit returns that subsidized underwriting losses. Today, those same investments earn low single digit returns and so now underwriting has to carry its own weight - this means that premiums from underwriting have to increase to compensate for lagging investment returns.  This is an excerpt from the report (page 13) to explain the impact of low interest rates on return on investment:

"Return on equity comes from two revenue streams –
underwriting and investment earnings.

In 2013, underwriting posted gains for the 11th consecutive
year. The 2013 net underwriting revenue was $648 million.
Before 2003, underwriting posted losses for 24 years in a row.

On investment, 2013 was a year of relatively low returns of 3.1%.
Return on investment moves in lockstep with the yields for
3- and 5-year Government of Canada bonds, which have fallen
for the last two decades."

Sliding investment returns means underwriting has to carry its own weight on insurance company balance sheets.

RSA Fresh Water Flood Coverage Acknowledges "Concurrent Causation" in Flood Damage Claims

An article in candianunderwriters.ca describes the new RSA fresh water endorsement expected to be available to the large majority of RSA customers.  It is encouraging to see the recognition that there has been 'concurrent causation' for flood damages:

"Some of the challenge we had with the floods in Alberta and in Toronto was this concurrent causation issue, where you had sewer backup happening at the same time as you had clean water flood coming in and you can't really say 'Part of it is brown water, part of it is clear water,'" the RSA representative said.

This represents progress in terms of characterizing the complexity of flood risks, but what is missing from the discussion (for Toronto table land type flooding as opposed to Alberta riverine flooding) is that:

Extraneous clear flow from groundwater infiltration
and inflow points enters the 'brown' sanitary sewer.
Comment 1) Sewer backup water during severe storms is often brown and clear together, because during extreme storms, the extraneous inflows to the sanitary sewer system dilute the typical brown water, typically by a factor of 10 to 1.  For infrastructure managers, the clear water components is often called RDII, or rainfall dependent inflow and infiltration - this clean water component can peak at up to 5 L/s/ha in a partially separated sewer system during an extreme event. Because of this, separating clear water and brown water risks is always difficult to do in practice.

Clear water surface flooding enters doors and windows and
exits low lying  upstream properties via floor drain.
Comment 2) The clear and brown water coming in typically occurs at different locations in the neighbourhood's drainage system.  Low-lying areas with low exposed openings can allow clear water to enter buildings and then exits via floor drains.  Those extraneous flows enter the sanitary sewer system and cause brown+clear water to enter downstream properties via floor drains.  Because of this, a downstream property may be vulnerable to brown water backup, because of an upstream property's clear water risk.

RSA indicated that regarding the old sewer backup coverage:

Downstream sanitary sewer overwhelmed with brown and
clear water creates backup, entering property via floor drain.
"In the past, that endorsement was much broader and in some respects would cover flood not intentionally but did cover flood."

Comment 3) What this means is that for some insurers, the backup premiums may have been increasing to pay for clear water, overland flood damages.  In my case, for example with a different insurer, the premium has increased 800% and the coverage limit has decreased for backup insurance - this could be explained by unintentional coverage of clear water, overland flooding in my city / neighbourhood. In an ideal world, RSA could decrease backup premiums by limiting coverage of uninsured perils like clear water, overland flooding, while pricing clear water flooding separately. .
Because of Comment 1 and 2, it will difficult to separate the different risk coverage

Just like cable TV, you can now pick and pay for your flood peril coverage:

"If you get Waterproof you get sewer backup and the flood, but if you don't want the Waterproof endorsement, if you don't want the flood, you can just buy limited sewer backup," RSA adds, saying that they are "putting a lot of emphasis" on training brokers.

Comment 4) This approach may meet RSA goals of limiting coverage for uninsured perils and increasing premiums for flood to help cover increasing costs during extreme events.  In the end, the bottom line for the business is not dependent on having an optimal, precise vulnerability assessment for individual properties - all it needs is a sub-optimal net positive outcome on the portfolio.  RSA is making an incremental adjustment toward a more sustainable, better priced risk model with the changes.

Not all properties are eligible for flood coverage though:

RSA noted  that for high risk properties, it would be difficult to cover fresh water flooding "because there is almost a guarantee that something is going to happen," she added.

Comment 5) High risk properties can include those in a defined river floodplains.  It is reasonable approach that coverage is not available and instead land use policies should deter such high risk developments over time.  What is missing in this approach is that governments and their agencies (Conservation Authorities in Ontario) and insurance companies are not managing all risks in a complete and comprehensive way.  Will RSA risk zones be shared with municipalities, or with property owners to support land use planning policies or flood proofing efforts by individuals or businesses? Not likely. Or will the sole purpose of the risk maps be to make decisions on the portfolio for the benefit of shareholders - that is likely - there is nothing wrong with that, but if so, let's take a step back and consider what the insurance industry's role really is in terms of managing society's flood risks.  Are the efforts by RSA to define flood risk a benefit to society or the balance sheet? Does it make sense that individual insurers redo overland flood risk assessments independently from each other, or should a public flood underwriter make those assessments to be shared by the insurance industry and municipalities?  In that manner, there would be no gaps in coverage and risk mitigation strategy.

Comment 6) What is needed to enhance the RSA sub-optimal, incremental improvement to risk pricing for flooding during extreme storms? The answer is a more robust, neighbourhood scale vulnerability model and a comprehensive approach to riverine flood risk.  This could result in and mandatory coverage for highest risk overland flood properties as one outcome.  Similarly, premiums for backup coverage could be increased in neighbourhoods with high overland flood risk, because clear water entering a few properties and overwhelm the sanitary sewer system in a widespread area. Our research shows how overland flood and backup (basement) flood risks are correlated in this post. Because risks are at a neighbourhood scale and policies are written at a property scale there is no way that the current insurance model can be optimal.

RSA notes in the article that "Canada doesn't have a lot of high risk zones with respect to flood."

Comment 7) In making this statement RSA should have distinguished between urban overland flash flooding and riverine flooding in a valley systems.  Certainly a low percentage of properties are within vulnerable valley flood plain areas where rivers and creeks can swell.  But on table land, urban flash flooding affects many neighbourhoods built before improved 1980's drainage standard improvements. These table land areas are where 'concurrent causation' really occurs.

Lastly RSA notes "That is going to be very clearly defined as what's covered and not covered"

Comment 8) Costs and revenue may be in a more sustainable balance with the RSA policy updates, but this may not necessarily be because policy coverage is more 'clear' in the future. As noted in the initial comments, there will generally always be some 'brown' mixed into the system when it comes to extreme storms.