The Philadelphia Water Department's has also reported extensively on green infrastructure costs and performance in their report Green City, Clean Waters Pilot Program Final Report. Highlights are presented below.
Green Infrastructure Capital Costs (Construction)
"The median construction cost per unit of impervious drainage area was $353,719/ac" - that equates to $872,000 per impervious hectare (2015 dollars).
"Median construction cost per unit of storage volume (Greened Acre) is $248,365/ac-in" - that equates to $2416 per cubic metre.
Overall costs appear to be increasing over time as shown in the following chart - to convert cost per acre to per hectare, multiply by 2.47 :
Green Infrastructure Construction Cost by Feature Type
Capital costs vary according to the type of green infrastructure (called GSI in Philadelphia). The following chart shows the variability in cost per managed impervious area for various types, suggesting some economies of scale for larger managed impervious areas.
The following chart shows the range of cost, median and average cost per managed impervious acre. A high variability in costs is shown from project to project.
Construction Cost by Loading Ratio / Efficiency
The cost efficiency of a green infrastructure project can vary according to its loading ratio, i.e., the relative size of the contributing runoff area to the project area itself. The following chart shows how project costs decrease for larger loading ratios - costs at ratios of 15 or greater are 25% less than costs for ratios of 10 and under. Also it appears that costs level-off for ratios of 15 and greater (i.e., the average cost for a loading ratio of 15 or greater is the same as for a loading ratio of 10 to 15).
Green Infrastructure Operation and Maintenance Cost
Operation and maintenance costs have been reported as well and show a wide variability. The following chart shows cost per impervious drainage area by broad type of green infrastructure, whether a subsurface or surface feature. The data indicates that surface features - those that are vegetated - cost on average more than subsurface features to maintain.
The average cost per impervious acre of $8000 equates to about $20,000 per impervious hectare. The following chart shows the variability in operation and maintenance costs according to each specific green infrastructure type. The chart shows for example higher costs for surface bumpouts and rain gardens than subsurface trenches and basins. For example, on average a bumpout costs almost twice as much as a subsurface basin.
The operation and maintenance cost appears to be approximately $20,000/$872,000 = 2.3% of capital cost. Lifecycle replacement / reconstruction of green infrastructure features, based on their deterioration over time, would generally add to this cost and could be considered to be 1-4% of capital cost depending on the service life of the feature (i.e., features that last 25 years add 4% depreciation, and those that last 100 years add 1%).
Using these unit costs, overall lifecycle costs for Ontario-wide implementation are explored below, assuming an initial 50-year build-out period and a range of green infrastructure measures with service life durations of 25 to 100 years.
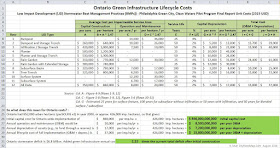
Given 852,000 urban hectares in Ontario, and assuming these are 50% impervious, the cost of green infrastructure retrofits in this province would be $370 billion dollars in capital construction cost (using $872,000 per impervious hectare) - that compares to the current Ontario stormwater infrastructure deficit of $6.8 billion. The Ontario-wide annual operation and maintenance cost for 426,000 impervious hectares would be $8.5 billion assuming $20,000 per impervious hectare - that O&M cost is over 1% of Ontario's GDP. Based on these costs, green infrastructure policies that prescribe wide-spread implementation require careful review for affordability. To recap:
Capital cost = $366 billion (using slightly lower unit cost of $860,000 per Row 12 below)
Annual O&M cost = $8.5 billion
Annual depreciation = $7.2 billion
Annual lifecycle cost (O&M + depreciation (reserve/rebuild)) = $15.8 billion
The following table summarizes the unit costs and illustrates the Ontario-wide costs that should be a cause for concern.
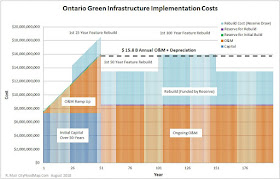
The follow chart illustrates the time series of costs including initial capital construction, operation and maintenance ramp-up followed by sustained operation and maintenance, reserve contributions for lifecycle asset reconstruction / rebuild according to service life (assumed 1/3 25-year, 1/3 50-year and 1/3 100-year durations), and rebuild costs (starting in year 26). It is assumed that 50 and 100-year service life assets are rebuilt over 50 a 50 year period, similar to the initial construction period.
Some academics, including those who promote green infrastructure for amenity or other stormwater management values, have proposed green infrastructure for the purpose of flood control as well. In order to achieve flood mitigation benefits, however, widespread implementation in the sewersheds or tributaries that have flood risks is required - in that case, the costs would appear to be prohibitive to achieve quantifiable flood reduction benefits. For illustrative purposes, a York Region 100 hectare catchment has recently undergone sewer capacity upgrades at a capital cost of approximately $20M and with nominal changes in net operation and maintenance cost (larger sewers replace older ones) and a 100 year service life - implementation was over 3 years. In comparison, the green infrastructure capital costs would be in the order of $872,000 * 50% impervious * 100 hectares = $44M with additional operation and maintenance costs and lower service life durations of 25-100 years, and long term implementation (over decades) with challenges on implementation on private properties, challenges with implementation in newer tributary catchment areas with low flood risk and high existing asset value (i.e., no co-benefits of watermain replacement, etc.). Basically, the conventional flood mitigation (grey infrastructure) approach is less expensive, has a shorter implementation time and more reliably addresses the flood risk issue (i.e., green infrastructure infiltration can aggravate wastewater inflow and infiltration stresses, can adversely affect foundations, and can be unreliable in high groundwater tables areas or during saturated conditions when green infrastructure storage in ineffective).
Some further case studies and detailed assessment are required to explore where and how some green infrastructure features can contribute to Ontario urban flood risk goals in a technically effective, timely and cost-effective manner. Similarly, analysis is needed to evaluate the strategic role of green infrastructure for achieving other stormwater management goals beyond flood risk mitigation.
***
How do Philadelphia GSI / green infrastructure costs compare to those of other jurisdictions? One can compare unit costs of $872,000 per hectare for Philadelphia's 1,100 projects with those in Onondaga County, New York. Costs for various types of green infrastructure measures are summarized in a recent article: http://stormwater.wef.org/2015/12/real-cost-green-infrastructure/http://stormwater.wef.org/2015/12/real-cost-green-infrastructure/.
The following chart illustrates lower unit costs with larger projects projects, similar to the Philadelphia reporting.
 |
| Green Infrastructure Unit Cost by LID (GSI) Type - Onondaga County, New York |
 |
| Green Infrastructure unit cost for projects managing up to 1.5 acres of impervious area - Onondaga County, New York |
The article citing Onondaga County green infrastructure costs notes that lower costs can be achieved by bundling implementation with other roadway works. In those cases costs were $320,000 per impervious hectare, or approximately $288,000 per total hectare, assuming 90% impervious coverage in those street projects.
Operation and maintenance costs for green infrastructure are summarized by CH2M as well. One observation that is similar to Philadelphia cost reporting is that vegetated systems are more costly to maintain than non-vegetated systems. The following chart summarizes costs per impervious area for various green infrastructure (LID, GSI) measures.
 |
| Green infrastructure operation and maintenance costs by type per impervious area managed. |


